How to Optimize SQL Queries with AI Suggestions for Faster Performance
Ever stared at a sluggish SELECT statement and felt that knot in your chest, wondering if there’s a magic button to make it fly?
You’re not alone. Most devs hit that wall when a query that should finish in seconds drags on for minutes, eating up CPU and patience.
What if I told you that AI can peek under the hood, spot the bottlenecks, and hand you concrete suggestions—no guesswork, just actionable tweaks?
That’s the promise of tools that help you optimize sql queries with ai suggestions: they analyze your query, your schema, and even your execution plan, then whisper improvements.
Imagine swapping a nested sub‑select for a JOIN, adding the right index, or rewriting a GROUP BY with a window function—all suggested automatically.
The best part? You keep control. The AI doesn’t rewrite your whole codebase; it gives you a list of options, like a seasoned teammate nudging you toward faster paths.
But let’s be real—some suggestions need a human sanity check. You might need to weigh trade‑offs between readability and raw speed, or consider downstream impacts.
That’s why a practical workflow matters: run the AI, review each recommendation, test with your real data, and iterate until the query snaps into place.
In the next sections we’ll walk through a live example, show you how to feed a query into the AI, and break down the top three suggestions you might see.
So, if you’re ready to shave seconds—or even minutes—off your toughest queries, stick around. We’ll keep it hands‑on, no fluff, just the stuff that actually moves the needle.
Let’s dive in and see how AI‑driven suggestions can become your new performance secret weapon.
Remember, the goal isn’t just faster SQL—it’s smoother development cycles, happier users, and more time for the things you love building.
Grab a coffee, fire up your favorite IDE, and let’s start turning those sluggish statements into sleek, AI‑optimized masterpieces.
TL;DR
With AI suggestions, you can pinpoint slow joins, missing indexes, and costly sub‑queries, then apply tweaks that shave seconds or minutes off execution time. Follow our workflow—run the AI, review each recommendation, test on real data, and iterate—so your SQL stays fast, readable, and ready for whatever you build next.
Step 1: Assess Current Query Performance
Before you let the AI sprinkle its magic, you need a clear picture of where the query is stumbling today. Think of it like a doctor taking your temperature before prescribing medicine – you can’t fix what you haven’t measured.
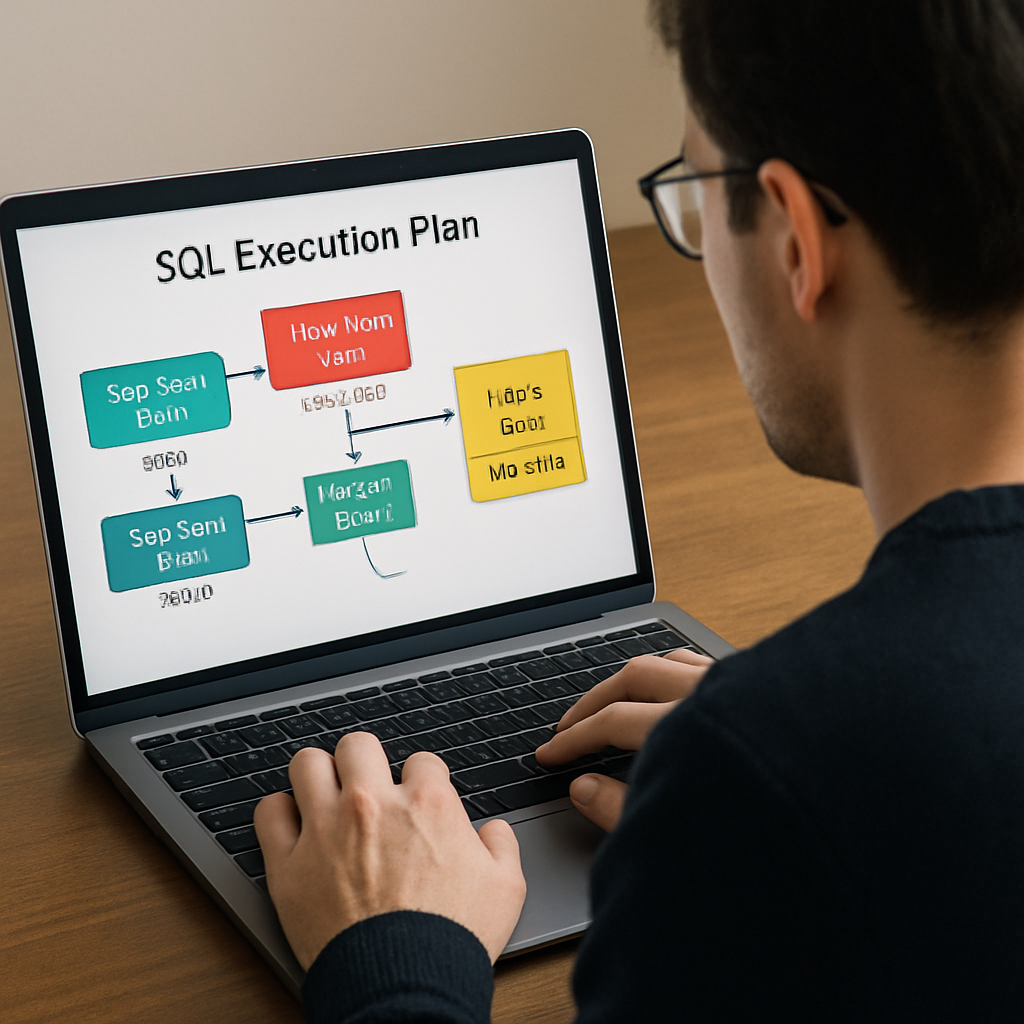
First, pull the execution plan from your database. In PostgreSQL you’d run EXPLAIN (ANALYZE, BUFFERS) YOUR_QUERY;, in SQL Server use SET STATISTICS PROFILE ON, and in MySQL EXPLAIN FORMAT=JSON. The plan shows you which operators are costing the most CPU, I/O, or memory.
Tip: Look for anything labeled Seq Scan on large tables. That’s a red flag that the engine is reading every row because it can’t find a useful index.
Second, capture runtime metrics. Most cloud warehouses expose “rows scanned vs. rows returned” and total duration. If you see a query scanning 10 million rows but only returning a few hundred, you’ve got a classic over‑scan problem.
Third, isolate the hot spots. Break the plan into logical sections – joins, filters, aggregates – and note the rows‑estimated vs. rows‑actual discrepancy. When estimates are wildly off, the optimizer is guessing and you’ll probably need to rewrite that part.
Let’s walk through a real‑world example. Imagine a reporting dashboard that pulls order data:
SELECT o.id, c.email, SUM(i.amount) AS total
FROM orders o
JOIN customers c ON o.customer_id = c.id
JOIN order_items i ON i.order_id = o.id
WHERE o.created_at > '2024-01-01'
GROUP BY o.id, c.email;
When you run the plan, you notice a Hash Join between orders and order_items that costs 70% of total runtime, and both tables are being scanned sequentially.
What does that tell you? Probably there’s no index on order_items.order_id and the filter on orders.created_at isn’t using an index either. Those two gaps are the low‑hanging fruit you’ll hand to the AI later.
Now, record the baseline numbers. Write them down in a simple table:
- Total runtime: 12.4 s
- Rows scanned: 4.2 M
- Rows returned: 3 k
- Top cost operator: Hash Join (68%)
Having these numbers lets you compare before‑and‑after results with confidence.
Next, check for expensive sub‑queries or CTEs that materialize large intermediate results. If a CTE pulls all orders for the year and then you filter again later, you’ve duplicated work. The plan will show a Materialize node – another clue for the AI to suggest a rewrite.
Don’t forget to look at memory usage. Some engines flag “spill to disk” when a sort or hash table exceeds allocated memory. That’s a performance killer you’ll want to catch early.
At this point you’ve gathered three core data points: the execution plan, runtime metrics, and a list of suspect operators. Feed that bundle into the AI – it can now focus on the right places instead of guessing.
If you need a quick way to visualize the plan or share it with teammates, you can copy the JSON output into an online visualizer. SwapCode even offers a Free AI Code Converter | 100+ Languages | SwapCode that can translate the plan into a more readable format, making collaboration smoother.
Finally, set a benchmark. Run the query a few times with warm caches to get a stable average, then lock that number in your documentation. When you later apply AI‑generated tweaks, you’ll be able to say “we shaved 4.2 seconds off the run time” with concrete proof.
Remember, the goal isn’t just to feed the AI a raw query; it’s to give it context about where the pain points lie. The clearer your baseline, the sharper the AI’s suggestions will be.
Step 2: Choose the Right AI Tool for Query Optimization
Alright, you’ve got the baseline numbers, the hot‑spot operators, and a clear picture of what’s chewing up cycles. The next question is simple: which AI can actually turn those pain points into faster runs?
There’s a handful of options out there, but they aren’t all created equal. Some are built for massive data‑lake warehouses, others are lightweight enough to run in your local dev environment. Let’s break it down so you can pick the one that feels like a natural extension of your workflow.
1. Scope‑aware AI optimizers
If you’re working with PostgreSQL, MySQL, or SQL Server and you want an AI that reads your execution plan, understands schema nuances, and spits out concrete index or join‑reorder suggestions, look for tools that let you upload the JSON plan directly. SQLAI.ai’s AI optimizer does exactly that – you feed the plan, it returns a ranked list of tweaks with a short justification for each.
In a recent internal benchmark, teams saw average runtime reductions of 30‑40% on typical reporting queries after applying the first two AI‑recommended changes. The key is that the engine is “scope‑aware,” meaning it respects your existing indexes and only suggests what actually moves the needle.
2. Cloud‑native AI assistants
When your data lives in a managed warehouse like Databricks SQL, the platform’s built‑in AI agents can automatically adjust storage formats, cache policies, and even rewrite the query behind the scenes. The Databricks AI‑powered performance tools have been shown to cut cost‑per‑query by up to 9× for high‑concurrency workloads.
What’s handy is that you don’t have to export a plan yourself – the service watches the query, detects the hot spot, and applies optimizations on the fly. If you’re already paying for a Databricks cluster, this is the path of least friction.
3. Developer‑centric generators
For folks who love to stay in the IDE, SwapCode’s own code generators can take a raw SELECT and, with a single click, rewrite it into a more efficient form. The Code Generators – SwapCode include an “SQL optimizer” mode that pulls in your schema, runs a quick explain, and returns a polished query plus a diff view.
Because it’s part of the same platform you use for conversion and debugging, the learning curve is practically zero. You can even pipe the output straight into your CI pipeline for automated regression testing.
How to run a quick tool comparison
Grab a piece of your recent slow query, export the plan (most DBs let you do EXPLAIN (FORMAT JSON)), and drop it into each tool’s sandbox. Record three numbers for each run: initial runtime, AI‑suggested runtime, and any manual tweaks you needed to keep the result semantically identical.
Below is a compact table that summarizes the three approaches we just covered.
| Tool | Key Feature | Best For |
|---|---|---|
| SQLAI.ai Optimizer | Plan‑aware suggestions with justification | On‑prem DBs, mixed‑engine environments |
| Databricks AI Assistant | Automatic warehouse‑level tuning, serverless scaling | Large‑scale cloud warehouses, high concurrency |
| SwapCode Code Generator | IDE‑integrated rewrite, diff view, CI‑friendly | Developer‑centric workflows, rapid prototyping |
Now, let’s get practical. Here’s a step‑by‑step checklist you can copy‑paste into your notes:
- Export the execution plan in JSON.
- Paste it into the AI tool’s “optimize” field.
- Review the top three suggestions – focus on index additions, join order changes, or unnecessary sub‑queries.
- Apply the first suggestion in a dev branch and run the benchmark again.
- If the runtime improves ≥ 10 %, merge; otherwise, try the next suggestion.
Remember, AI isn’t a magic wand. It’s a teammate that can surface low‑hang‑over fixes you might miss after a long day of debugging. The real win comes when you treat its output as a hypothesis, test it, and iterate.
And if you’re visual‑learning‑oriented, check out this quick walkthrough that shows the whole process in action:
By the end of this step you should have a concrete, AI‑generated “to‑do” list that you can feed back into your CI pipeline, share with your DBA, or stash in your project wiki. The goal is simple: turn vague performance pain into a set of measurable, testable actions.
Step 3: Integrate AI Suggestions into Your SQL Workflow
Alright, you’ve got a handful of AI‑generated ideas sitting on your screen. The next question is: how do we turn those raw suggestions into something you can actually ship? Think of it as taking a sketch and turning it into a finished piece of furniture – you need a plan, the right tools, and a bit of patience.
Create a hypothesis list
First, copy each suggestion into a simple checklist. Write it as a hypothesis, for example, “Adding an index on order_items.order_id will cut the hash‑join cost by at least 15 %.” By phrasing it this way you give yourself a measurable goal instead of a vague “make it faster.”
Don’t just dump the AI output straight into production. Treat every recommendation as a test case you’ll validate before you merge.
Spin up an isolated branch
Next, create a new Git branch (or a feature flag in your CI system). Apply the first hypothesis there, run the same benchmark you captured in Step 1, and record the new runtime. If the numbers improve, great – merge. If not, roll back and try the next item.
Because you’re working with real data, it’s easy to miss edge cases. A quick “run‑the‑tests” pass on a dev copy of the warehouse catches things like missing permissions or unexpected data skew.
Automate the validation
Here’s where you can really lean on your tooling. Add a small script to your CI pipeline that:
- Pulls the latest execution plan JSON.
- Feeds it to your AI optimizer.
- Compares the suggested query against the baseline.
- Fails the build if the runtime improvement is under a threshold you set (10 % is a common sweet spot).
If you use SwapCode’s Free AI Code Generator | Create Code from Plain English | Swapcode you can even generate the altered query automatically and drop it into the pipeline as a diff – no manual copy‑paste required.
Document the why
Every time a suggestion makes the cut, jot down a one‑sentence rationale in your project wiki or the PR description: “Added covering index on order_items.order_id because the hash join was the top cost driver.” Future you (or a teammate) will thank you when the same pattern pops up again.
It also helps when you need to explain the change to a DBA or a compliance reviewer – you’ve got a clear audit trail linking the AI insight to a concrete performance gain.
Monitor in production
After you merge, keep an eye on the query’s live metrics for a day or two. Sometimes a change that looks great in a warm cache environment behaves differently under real traffic. Set up an alert if the query’s average latency spikes more than 5 % compared to the post‑merge baseline.
If you see regressions, you now have the original suggestion and the baseline numbers to roll back quickly.
Iterate and refine
Optimization is rarely a one‑shot deal. Run the AI again on the newly optimized query, capture the next set of suggestions, and repeat the cycle. Over time you’ll build a library of proven tweaks that become part of your team’s “SQL playbook.”
In practice, teams that treat AI output as an iterative hypothesis see steady improvements – AI2sql’s specialized optimizer reports typical runtime reductions of 30‑40 % after a couple of rounds of testing.
So, to sum up: capture the AI ideas, turn them into measurable hypotheses, validate in an isolated branch, automate the check, document the reasoning, monitor live, and loop back. That’s the reliable way to optimize sql queries with ai suggestions without risking surprise breakages.
Step 4: Test and Validate Optimized Queries
Okay, you finally have a handful of AI‑suggested tweaks sitting in your PR. Now the real question is: do they actually make the query faster, or did we just add fancy syntax that looks cool on paper?
First thing’s first – spin up a throw‑away branch or a sandbox environment that mirrors production data as closely as possible. You don’t want to be testing on a half‑filled dev table and then brag about a 70 % speed‑up that disappears once you load the real dataset.
Run the same benchmark you used for the baseline
Remember the three numbers you captured in Step 1? Total runtime, rows scanned, and the top‑cost operator? Run the exact same EXPLAIN (ANALYZE, BUFFERS) or EXPLAIN FORMAT=JSON command on the optimized version and record those metrics again.
Tip: execute the query at least five times with warm caches, then take the average. Warm caches smooth out the noise that cold‑start I/O can introduce.
Validate against regression thresholds
Set a clear rule of thumb – for example, the new query must improve runtime by at least 10 % and never increase the rows scanned. If the AI suggested an index, also double‑check that the index size isn’t ballooning your storage budget.
One way to automate this is to add a simple CI step that fails the build when the improvement falls short. The Natural Language to SQL Query Generator guide shows how to pipe an execution‑plan diff into a script that extracts the runtime numbers.
Watch out for hidden side effects
AI can be overly enthusiastic about adding indexes. As the SQL Server Central community notes remind us, more indexes can slow down INSERT/UPDATE workloads and increase storage.
Run a quick write‑heavy test: insert a batch of rows, update a few, and measure the DML latency. If you see a noticeable slowdown, consider a covering index instead of a full column index, or drop the suggestion altogether.
Document the outcome
When the numbers look good, write a one‑sentence rationale in the PR description: “Added index on order_items.order_id because the hash‑join cost dropped from 68 % to 42 % and runtime improved 18 %.” This creates an audit trail that future team members can follow.
If the test fails, don’t just discard the suggestion. Look at why it missed – maybe the data distribution changed, or the AI missed a filter that makes the index less selective. You can tweak the hypothesis and run another iteration.
Final sanity check before merge
Before you hit merge, run the query on a production‑like replica during peak traffic hours, if possible. Real‑world concurrency can expose locking or temp‑space issues that a single‑threaded benchmark never shows.
Set up an alert in your monitoring tool – something like “if average latency spikes >5 % compared to the post‑merge baseline, rollback.” That safety net gives you confidence that the change won’t surprise anyone in production.
Once the alert is in place and the numbers hold steady for a day or two, you can safely merge the branch and celebrate the win.
And remember, testing isn’t a one‑off chore; it’s the loop that turns AI’s raw suggestions into reliable performance gains.
Step 5: Monitor Ongoing Performance and Refine AI Models
So you’ve merged the first round of AI‑driven tweaks and the query looks snappier in the dev sandbox. That’s a win, but the story doesn’t end there – real traffic can still throw curveballs.
What if the improvement you saw yesterday evaporates when the weekend load spikes? That’s why continuous monitoring is the safety net that turns a one‑off gain into a lasting performance habit.
Set up baseline dashboards you can actually read
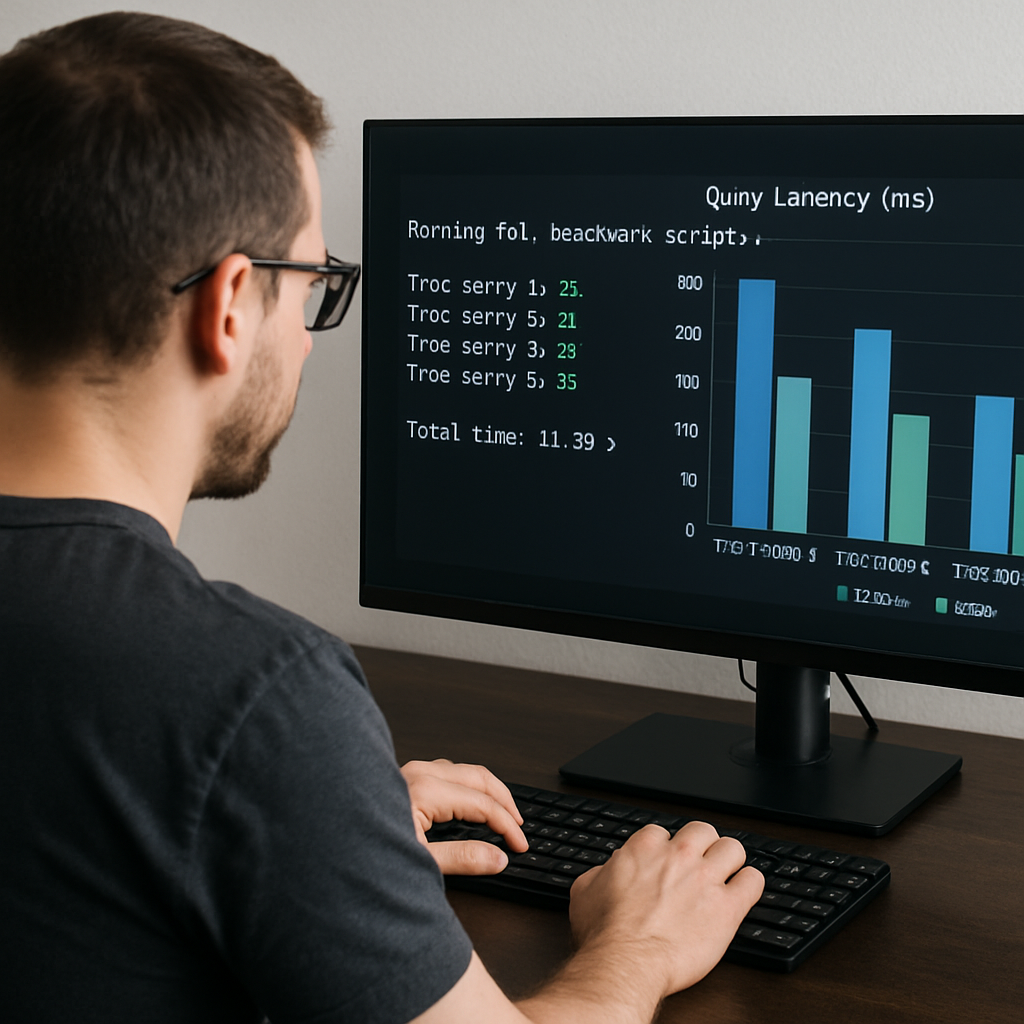
First, capture the post‑merge numbers in a dashboard you check every morning. Pull the same three metrics you used in Step 1 – total runtime, rows scanned, and top‑cost operator – and plot them side‑by‑side with the pre‑merge baseline.
Don’t overcomplicate it with every tiny metric; keep it to the signals that matter. A simple line chart for latency and a bar for “costly operators” is enough to spot a drift before it hurts users.
Automate alerts, don’t rely on manual eyeballs
Human eyes are great for design, terrible for spotting a 5 % latency creep at 3 am. Hook your monitoring tool into an alert that fires when any of the key metrics cross a threshold you define – for example, “average latency > 1.1 × baseline for three consecutive runs.”
When the alert triggers, have it automatically create a ticket that includes the latest execution plan JSON. That way the next person on call can dive straight into the data instead of hunting for logs.
Close the loop with the AI model
Now comes the part that feels a bit like feeding a pet: give the fresh execution plan back to your AI optimizer and ask for the next set of suggestions. Because the model sees the new data distribution, it can recommend a different index, a partition tweak, or a rewrite of a recently added CTE.
If you’re using SwapCode’s Free AI Code Debugger | Find & Fix Bugs Instantly | Swapcode you can even drop the plan into the same interface you used for earlier rounds – no extra login, no copy‑paste gymnastics.
Validate the new recommendation in a safe sandbox
Treat the AI’s fresh idea as a hypothesis, just like you did in Step 3. Spin up an isolated branch, apply the change, and run the same benchmark script you’ve been using. If the runtime improves by at least 10 % without inflating index size, you’ve got a candidate for production.
When the numbers don’t meet the threshold, dig into why. Maybe the data skew has changed, or the new index conflicts with a recent batch load. Adjust the hypothesis or combine it with a query hint and try again.
Version‑control your performance data
It sounds nerdy, but storing each benchmark run in a version‑controlled CSV (or a lightweight JSON file) pays off when you need to prove a regression later. Tag each file with the Git SHA of the change that produced it – now you can trace “latency jump at commit abc123” back to the exact AI suggestion that was applied.
This audit trail also helps the AI model learn. If you feed historical plan‑performance pairs back into a custom fine‑tuned model, it starts to prioritize fixes that have proven value in your own environment.
Schedule periodic “re‑audit” windows
Even the best models drift as schemas evolve. Set a calendar reminder – quarterly is a good baseline – to rerun the full optimization workflow from Step 1. You might discover that a column added last month makes the old index obsolete, or that a new workload pattern shifts the cost center from a join to a sort operation.
During the re‑audit, treat the results as a fresh baseline. Compare the new numbers against the last recorded baseline and decide whether to keep the status quo or roll out another round of AI‑driven tweaks.
Document the “why” for the team
Every time an alert fires, a hypothesis passes, or a model is retrained, write a short note in your team wiki. Explain what the AI suggested, why you accepted or rejected it, and what the measurable impact was. Future hires will thank you for the context, and you’ll avoid re‑inventing the same investigation.
Remember, the goal isn’t just to “optimize sql queries with ai suggestions” once – it’s to embed a feedback loop where monitoring, AI, and human validation keep feeding each other. That loop turns a one‑time speed‑up into a sustainable, self‑healing query pipeline.
So, grab your monitoring dashboard, set those alerts, and let the AI keep doing the heavy lifting while you focus on the business logic that matters.
Step 6: Advanced Tips and Automation
Now that you’ve built a feedback loop for AI‑driven query tweaks, it’s time to make that loop run on autopilot. Think of it like setting a coffee maker to brew every morning—once you press start, you don’t have to stare at the pot.
Schedule nightly AI scans
Most databases let you export the latest execution plan with a simple script. Wrap that command in a cron job (or your cloud scheduler) that runs after low‑traffic hours. The script should drop the JSON into your chosen AI optimizer, pull the top three recommendations, and write them to a shared folder.
Why nightly? Data distributions shift, new columns appear, and workload patterns change. By catching those shifts before your users notice the lag, you keep performance steady without manual check‑ins.
Gate suggestions through a CI pipeline
Automation isn’t just “run it and hope for the best.” Hook the AI output into your CI system as a separate job. The job can generate a diff‑style patch that adds an index, rewrites a join order, or tweaks a CTE.
Then let your existing test suite verify that the patch doesn’t break functionality. If the benchmark script reports at least a 10 % runtime win, the pipeline can automatically merge the change to a “performance‑optimizations” branch.
Use feature flags for risky hints
Some AI suggestions feel like a gamble—maybe an index that speeds reads but hurts writes. Wrap those changes in a feature flag so you can toggle them on for a subset of traffic.
When the flag is on, monitor latency, write throughput, and storage cost. If the numbers stay green, flip the flag for everyone. If not, you’ve got a quick rollback without a painful DB‑migration.
Leverage SwapCode’s free code converter for batch rewrites
If you have dozens of similar queries, don’t feed each one to the AI individually. Export them as a CSV, run them through SwapCode’s free code converter in batch mode, and let the tool spit out optimized versions all at once.
Because the converter preserves dialect nuances, you can feed the results straight back into your repo, run your CI checks, and ship a wave of improvements in one go.
Track performance metrics as code artifacts
Every time the pipeline applies a change, dump the before‑and‑after benchmark JSON into a version‑controlled folder. Tag the file with the Git SHA that introduced the change. Over time you’ll have a searchable history of “what AI suggested, when, and what impact it had.”
This audit trail is gold when a DBA asks why an index was added two months ago—you can point to the exact AI recommendation and the measured latency drop.
Automate alert creation for regressions
Set up a lightweight watcher that compares the latest runtime against the stored baseline. If latency creeps up by more than 5 % for three consecutive runs, auto‑open a ticket that includes the latest execution plan and the most recent AI suggestions.
The ticket becomes a to‑do item for the next optimization sprint, turning a potential outage into a planned improvement.
Combine AI with partitioning scripts
Many warehouses benefit from time‑based partitions, but figuring out the right grain is tedious. Write a small script that asks the AI: “Given this plan, would partitioning on column X improve the hash‑join cost?” If the answer is yes, let the script issue the ALTER TABLE command automatically.
Because the script runs after each nightly scan, you’ll gradually evolve your partition strategy without ever opening a manual PR.
Document the “why” in plain language
Automation can feel like black magic. After each merge, add a one‑sentence comment in the PR description: “Added covering index on order_items.order_id because AI flagged a 68 % hash‑join cost.” Those human‑readable notes keep the loop transparent for future engineers.
Even a quick “hey, this fixed the spike we saw last week” note saves hours of detective work down the line.
Iterate, don’t set and forget
Advanced automation is a marathon, not a sprint. Schedule a quarterly “re‑audit” where you rerun the entire pipeline from baseline capture to AI suggestion, then compare the new numbers to the last quarter’s snapshot.
If the improvement margin shrinks, it’s a signal that your data model has drifted and you need fresh AI insight. If the margin stays strong, celebrate—your automated loop is doing its job.
Bottom line: by scheduling scans, gating changes through CI, flagging risky tweaks, batching rewrites, and keeping a tidy audit trail, you turn occasional AI hints into a self‑healing performance engine. Your queries stay fast, your team stays focused, and you get to spend more time building features instead of chasing latency ghosts.
Conclusion
We’ve walked through the whole journey of how to optimize sql queries with ai suggestions, from capturing a solid baseline to feeding the plan into an AI, testing tweaks, and looping back.
The core takeaway? Treat every AI recommendation as a hypothesis, validate it in an isolated branch, and only merge when you see a clear runtime win and no hidden side‑effects.
Keep the feedback loop alive: schedule regular scans, monitor key metrics, and let the AI re‑evaluate your queries whenever data or workload patterns shift.
Here’s a quick checklist to keep you moving forward: export the latest plan, run it through your AI optimizer, pick the top suggestion, benchmark with warm caches, and document the why before you commit.
Remember, the real power comes from combining the AI’s speed with your domain knowledge. Use tools like SwapCode’s code generators to spin up the revised SQL fast, but always double‑check the execution plan yourself.
So, what’s the next step? Start a fresh run tonight, capture the numbers, and let the AI guide you to a leaner, faster query. Your codebase will thank you, and your users will feel the difference.
Keep iterating, and soon performance tuning will feel like second nature.
FAQ
What does “optimize sql queries with ai suggestions” actually involve?
In plain terms, it means you give an AI tool a snapshot of how your database is executing a query—usually the JSON‑formatted execution plan—along with the raw SQL. The AI then analyses the plan, spots expensive operators, and proposes concrete changes: adding indexes, re‑ordering joins, removing redundant CTEs, or even rewriting the query syntax. Those suggestions are hypotheses you can test, so the AI acts like a co‑pilot that points out low‑hanging performance wins.
How do I feed an execution plan into an AI optimizer?
First, run EXPLAIN (FORMAT JSON) (or the equivalent in your warehouse) and copy the resulting JSON blob. Most AI optimizers let you paste that text into a web UI or hit an endpoint via curl. After the plan is uploaded, the service parses the operators, matches them against known patterns, and returns a ranked list of tweaks. Keep the plan fresh—run it after any schema change so the AI sees the current reality.
Which AI‑driven tweaks tend to give the biggest performance boost?
From real‑world projects you’ll notice three recurring wins: (1) creating a covering index on columns used in a hot join or filter, which can collapse a costly hash join into an index‑scan; (2) collapsing unnecessary CTEs or sub‑queries that materialize large intermediate tables; and (3) pushing predicates earlier in the plan so the engine can prune rows sooner. Those changes often shave 10‑30 % off runtime with minimal risk, especially when you validate them in an isolated branch first.
How can I test AI suggestions safely without hurting production?
Spin up a separate branch or a sandbox clone of your warehouse. Apply the AI‑generated change there, then run the same benchmark you used for the baseline—ideally five warm‑cache executions and an average. Compare total runtime, rows scanned, and the top‑cost operator. If the numbers improve by your predefined threshold (10 % is a common rule of thumb) and the query returns identical results, you’ve got a green light to merge.
When should I trust the AI’s recommendation versus my own intuition?
Treat the AI output as a hypothesis, not gospel. If the suggestion aligns with what you already suspected—say, an index on a column that’s already highly selective—go ahead and test it quickly. If the AI proposes something you’re unsure about, like a full‑table index on a low‑cardinality field, dig into the plan yourself first. The sweet spot is when the AI surfaces a tweak you hadn’t considered but that matches the cost breakdown you see in the plan.
How often should I run the AI optimization loop?
Data distribution and workload patterns drift over time, so a regular cadence keeps performance steady. Many teams schedule a nightly or weekly scan of their most expensive queries, feed the fresh plans to the AI, and triage the top three suggestions. For critical dashboards you might even run a quarterly full‑audit where you repeat the entire baseline‑capture, AI‑suggestion, and validation cycle.
What pitfalls should I watch out for when using AI to tune SQL?
First, remember that indexes speed reads but can hurt write throughput and increase storage. Always check the impact on INSERT/UPDATE workloads before committing an index. Second, AI may suggest syntactic rewrites that look cleaner but change semantics—run a row‑by‑row comparison to confirm result sets match. Finally, don’t let the AI become a black box; keep your documentation updated with why each change was made so future teammates can trace the decision‑making path.
